C2M2 Graph Query Interface
Table of Contents
Introduction
Background
The NIH Common Fund (CF) program is a cross-cutting initiative across the National Institutes of Health (NIH) to accelerate biomedical scientific discoveries. Various CF programs were established at different times, resulting in valuable datasets of unique data types. Since these programs developed independently, each one created its data model, data elements, and ontology encodings to represent their datasets, leading to fragmented data silos. One of the missions of the CF Data Ecosystem (CFDE) is to harmonize and integrate these multimodal datasets to facilitate biomedical discovery. The Cross-Cut Metadata Model (C2M2) is a flexible F.A.I.R. framework for representing and sharing CF datasets. It standardizes experimental resources and products while promoting the harmonization and integration of these isolated data repositories. This framework enables federated querying, data aggregation, and the integration of diverse datasets using harmonized metadata.
Graph Query System for C2M2
CFDE is a dynamic entity that continuously inducts new CF programs. To meet the needs of this growing community, the C2M2 must be flexible enough to accommodate new metadata, data types, and their encodings. Given its dynamic nature, NoSQL databases are ideally suited for these requirements, as they are schemaless and can evolve with the changing demands of CFDE with minimal disruption. Among the NoSQL databases, we have chosen Neo4j as our graph database because it supports a labeled property graph model, which accurately represents the complex data of C2M2. Neo4j stores data in a graph structure, making it a flexible and agile database that is easy to maintain and grow alongside the evolving needs of C2M2. Additionally, it allows for native graph processing, which enhances performance through index-free adjacency, enabling constant-time lookups regardless of data size and facilitating complex queries on highly interconnected C2M2 data.
Architecture
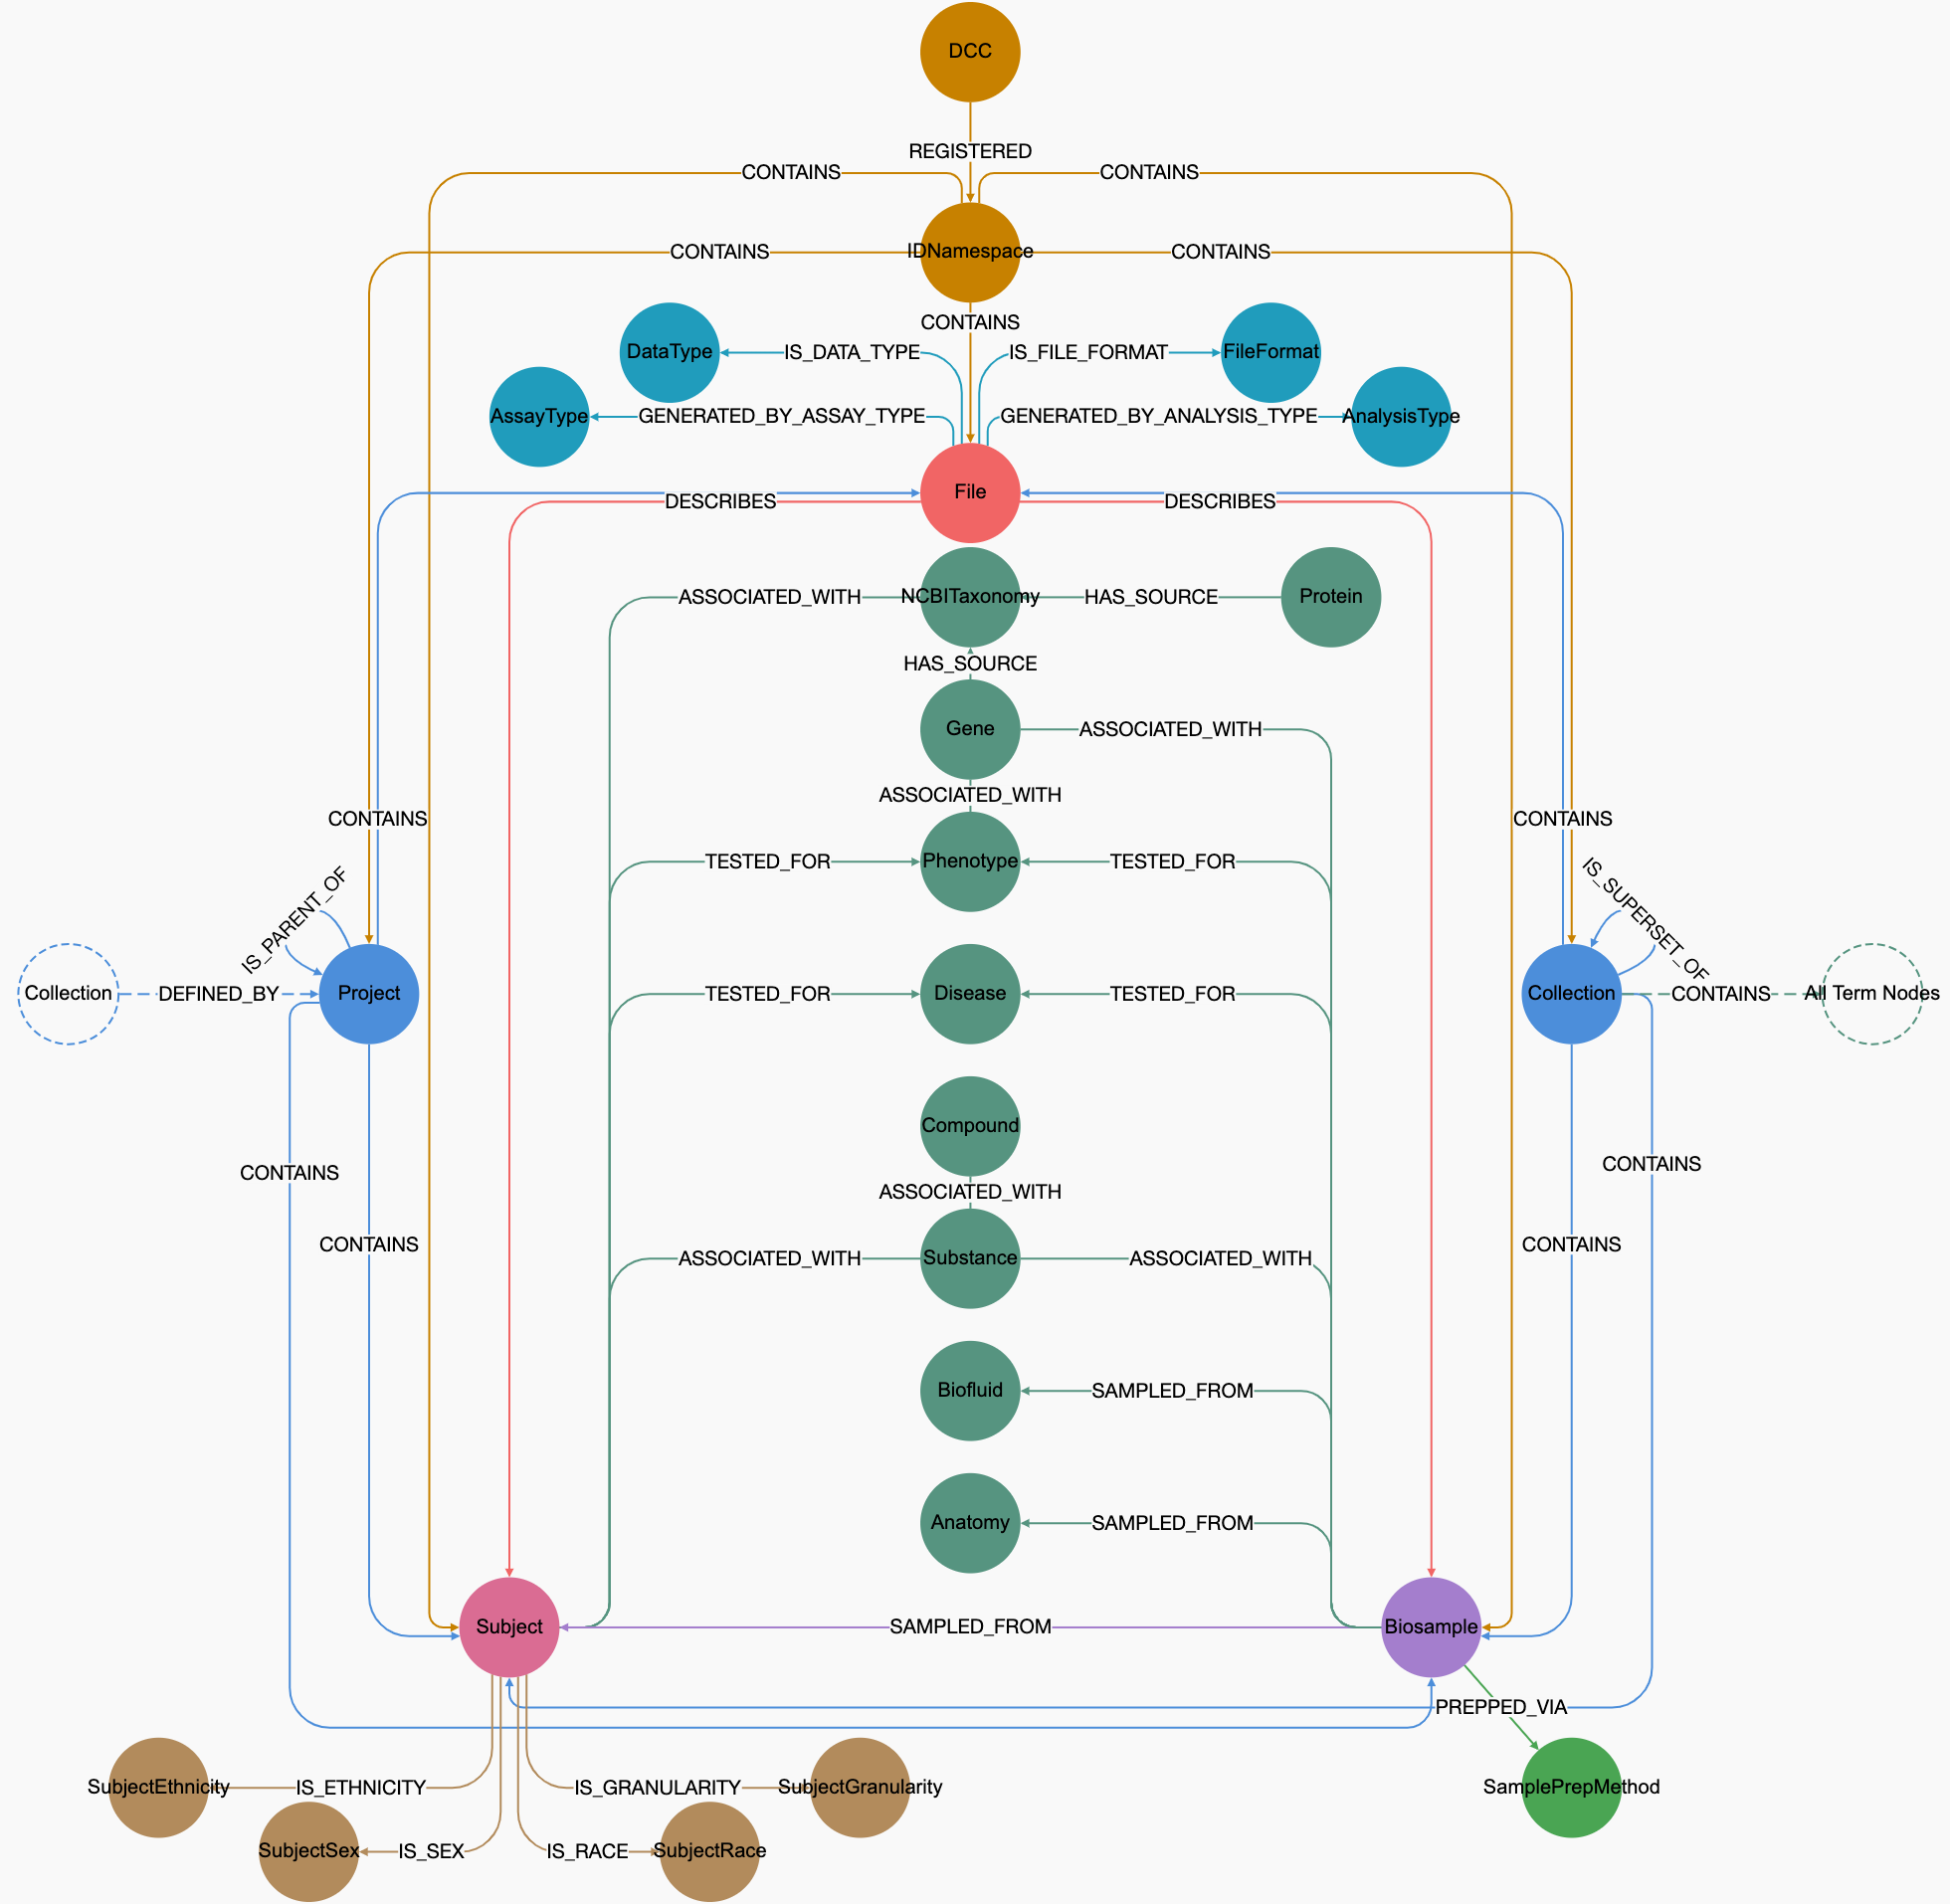
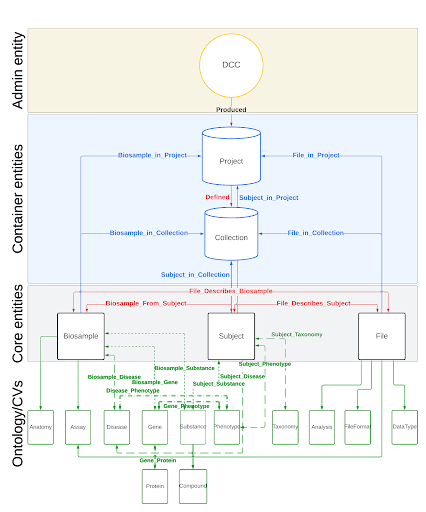
We created a minimalistic user interface (UI) by leveraging the hierarchical structure of C2M2 entities and their relationships, along with the ontologies and controlled vocabularies (CVs) that define the metadata for these entities. We used the CVs as the gateway for data search and discovery. Utilizing these ontologies and CVs enables searches based on synonyms, acronyms, toponyms, variants, and more.
Interface
Query Building
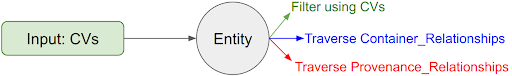
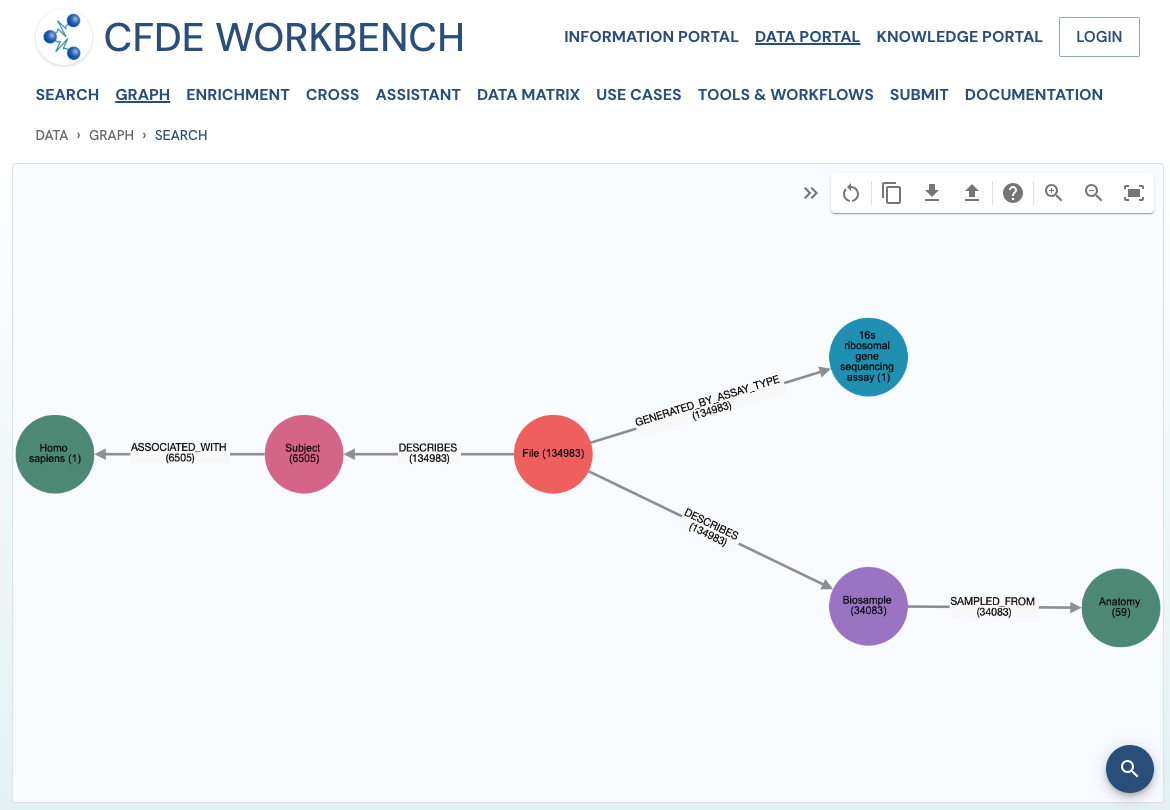
Once we access an entity, we can navigate the underlying relations to retrieve other entities or filter them based on their attributes, one node at a time. This process relies on the database's schema and the available data, eliminating the risk of running into 'path not found' or 'data not found' issues. It also removes the need for users to understand the C2M2 schema to search for data.
Streamlined User Interface
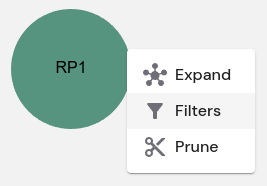
We provide standard 'Menu' options ("Expand", "Filter", "Prune") for every node by default. Again, this is driven by the context and available data.
User Interface
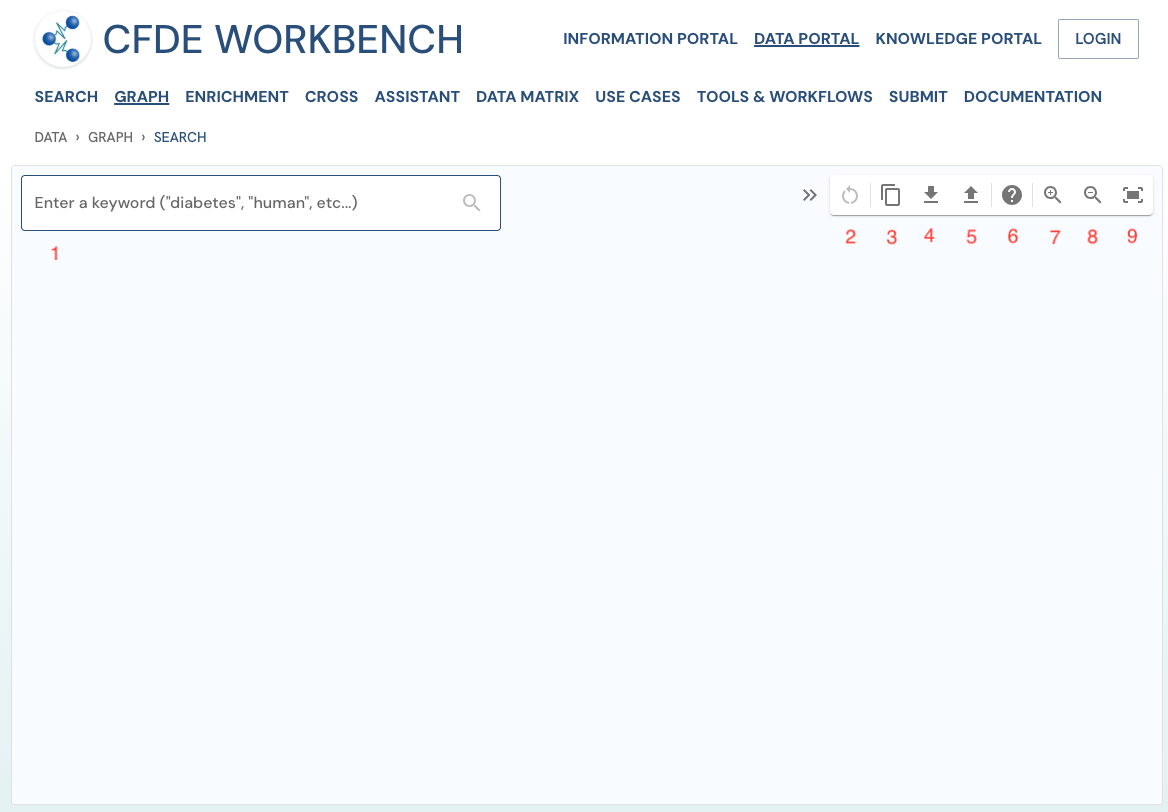
The UI is a clean, intuitive, interactive canvas with minimal control tools. The initial interaction point is the text input field on the top left. On the right, a collapsible toolbar with 'Start Over', 'Download/Upload Pathway' and Zoom controls ('Zoom In', 'Zoom Out' and 'Fit Graph').
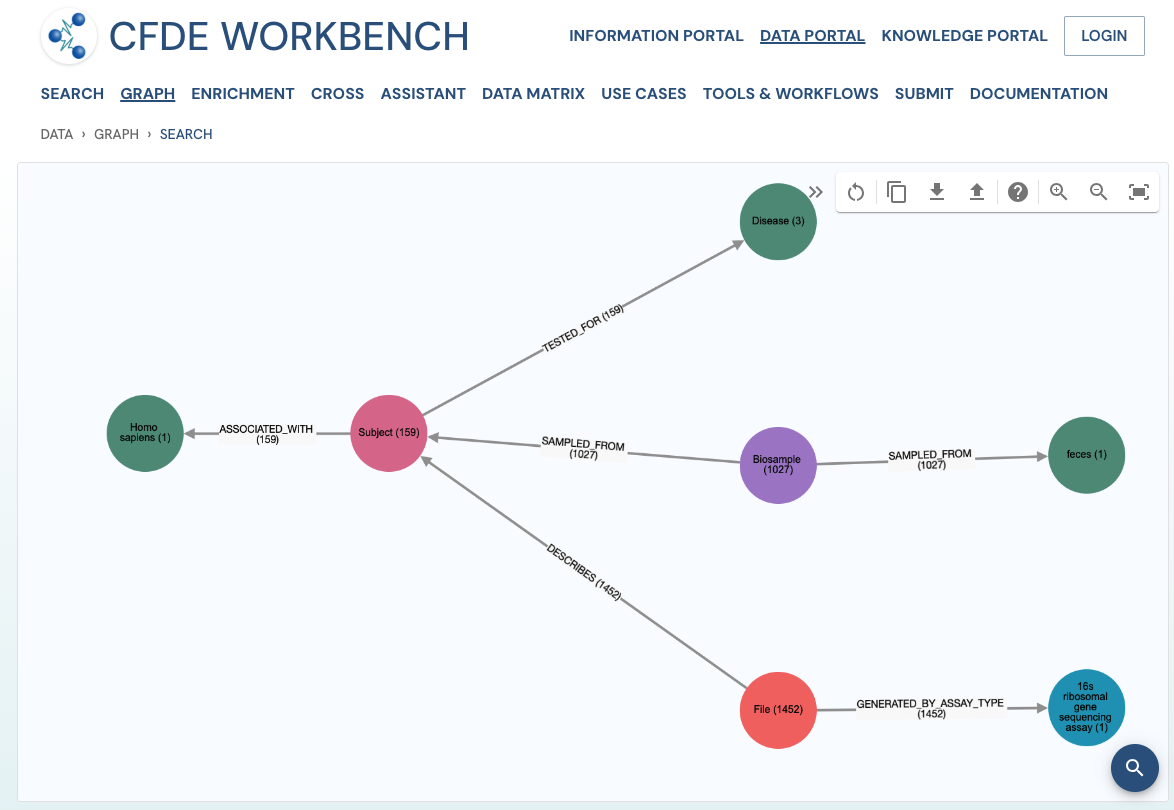
The 'Expand' option will cue the user to explore the possible relationships based on the underlying schema and data availability for the entity/search path. With the 'Filter' option, one can subset the data by instantiating a specific value to a class object (ex, asthma for the 'Disease' class). With the 'Prune' option, one can edit the search path by removing a node(s) and their relationship(s).
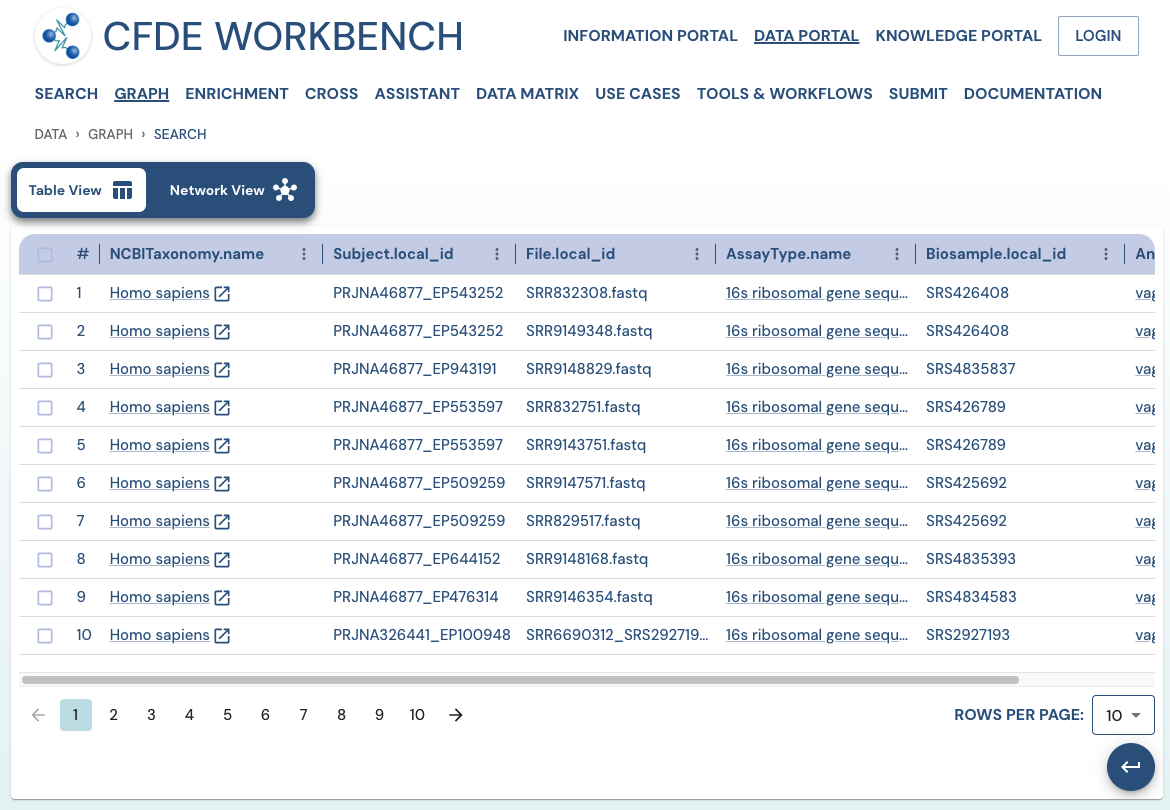
Search Results
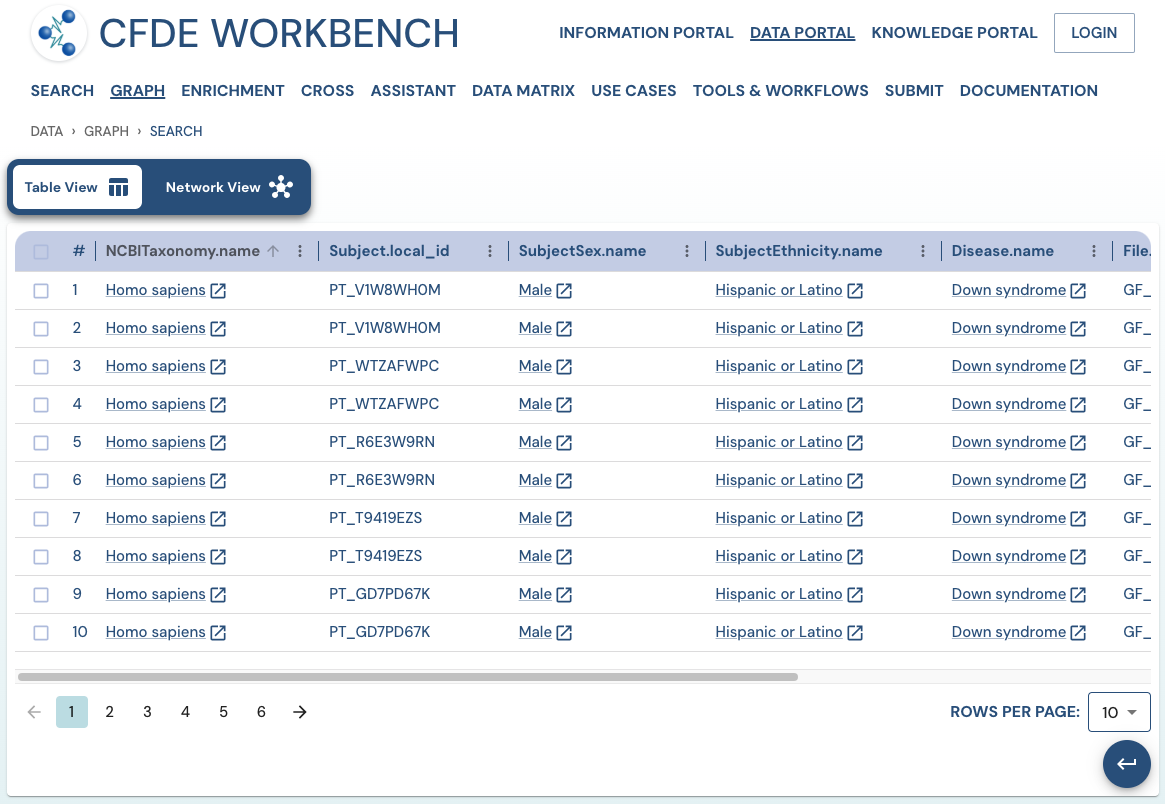
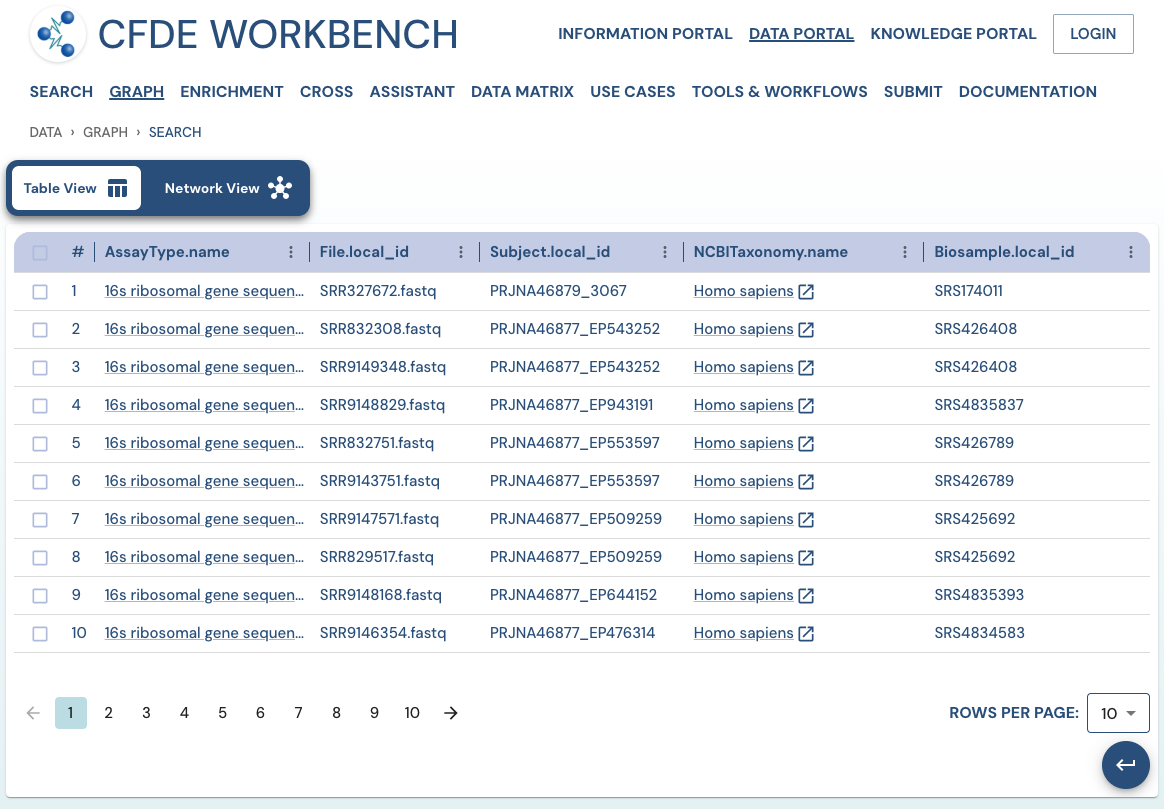
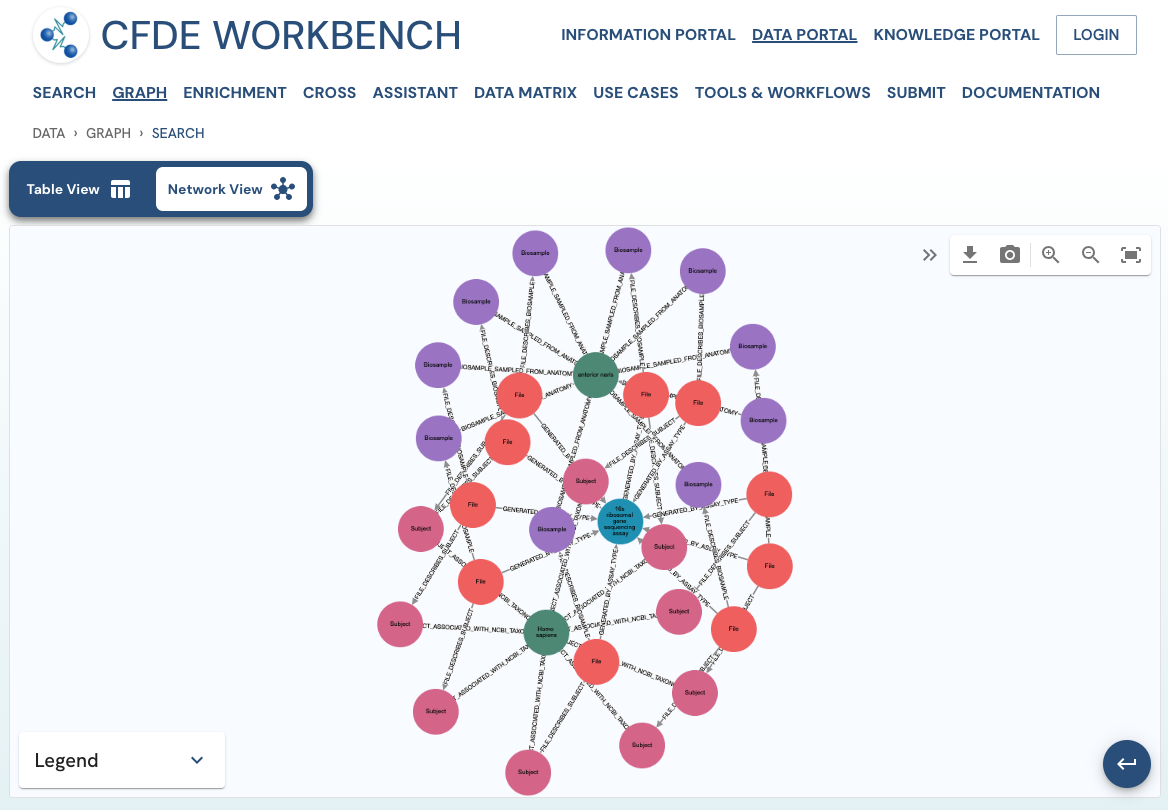
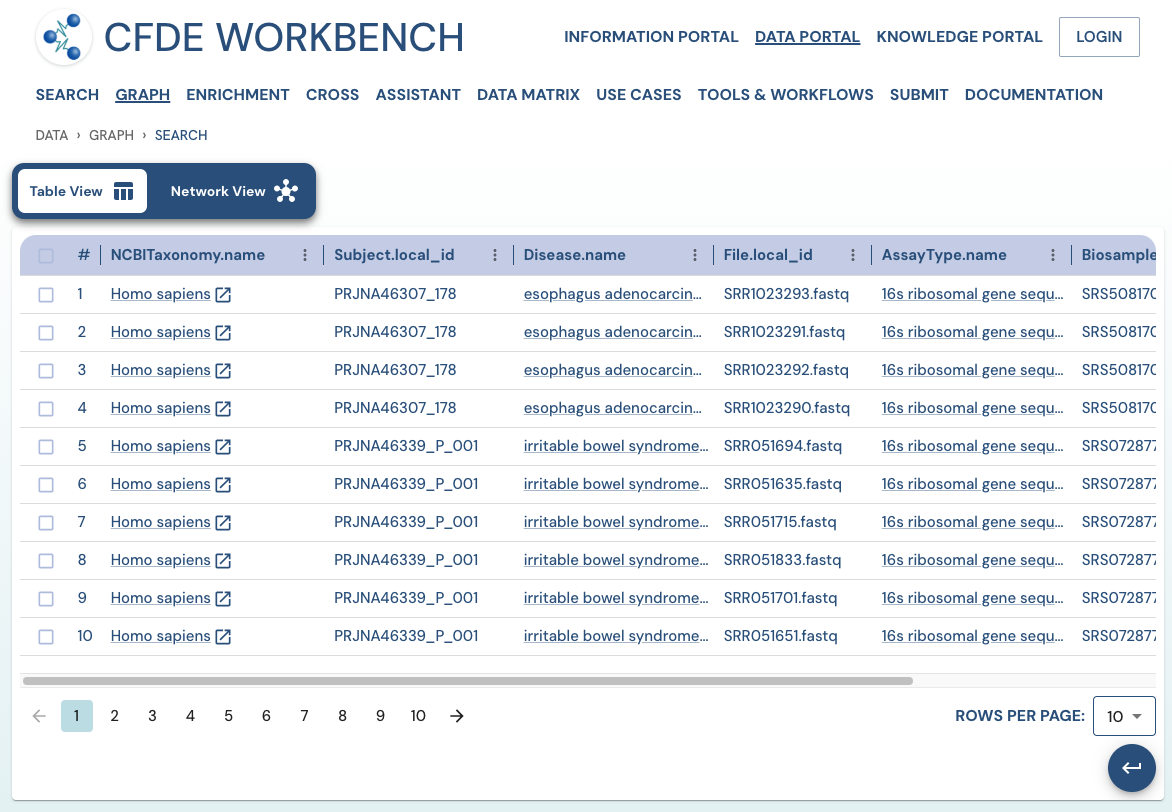
Search Results: A pathway search will present the results in Tabular View and Network View. In the Table view, each row (Record) corresponds to the ‘Search Path’, and each column corresponds to an entity/attribute in the pathway. The values in the cell provide the ‘drs link’ to a ‘File’ or the ‘Persistent_Id’ for a Subject/Biosample/Project/Collection and URI for the Ontology/CV term. The results are paginated with easy access to any page at random. The number of records per page can also be controlled (10/25/50 records per page). The results can be downloaded (either selected rows, the current page, or all results) as a nested JSON object for further processing in a cloud workspace or a local computer.
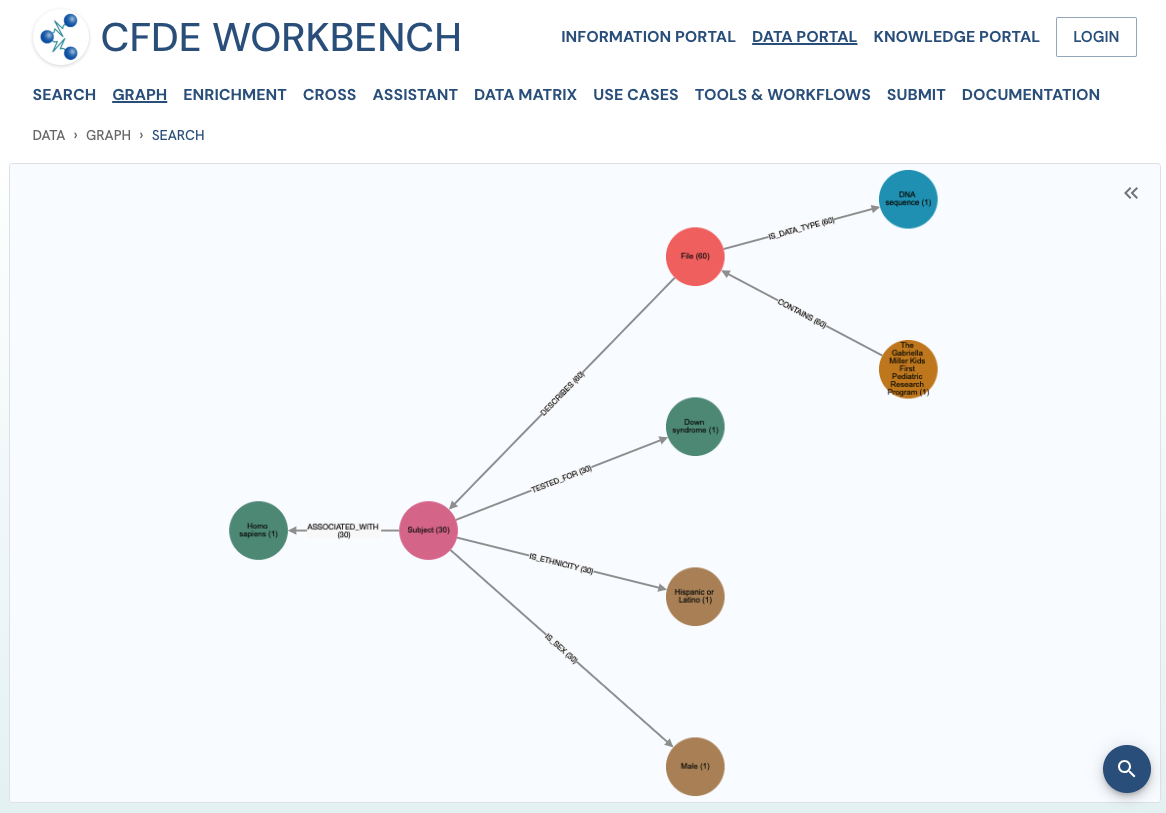
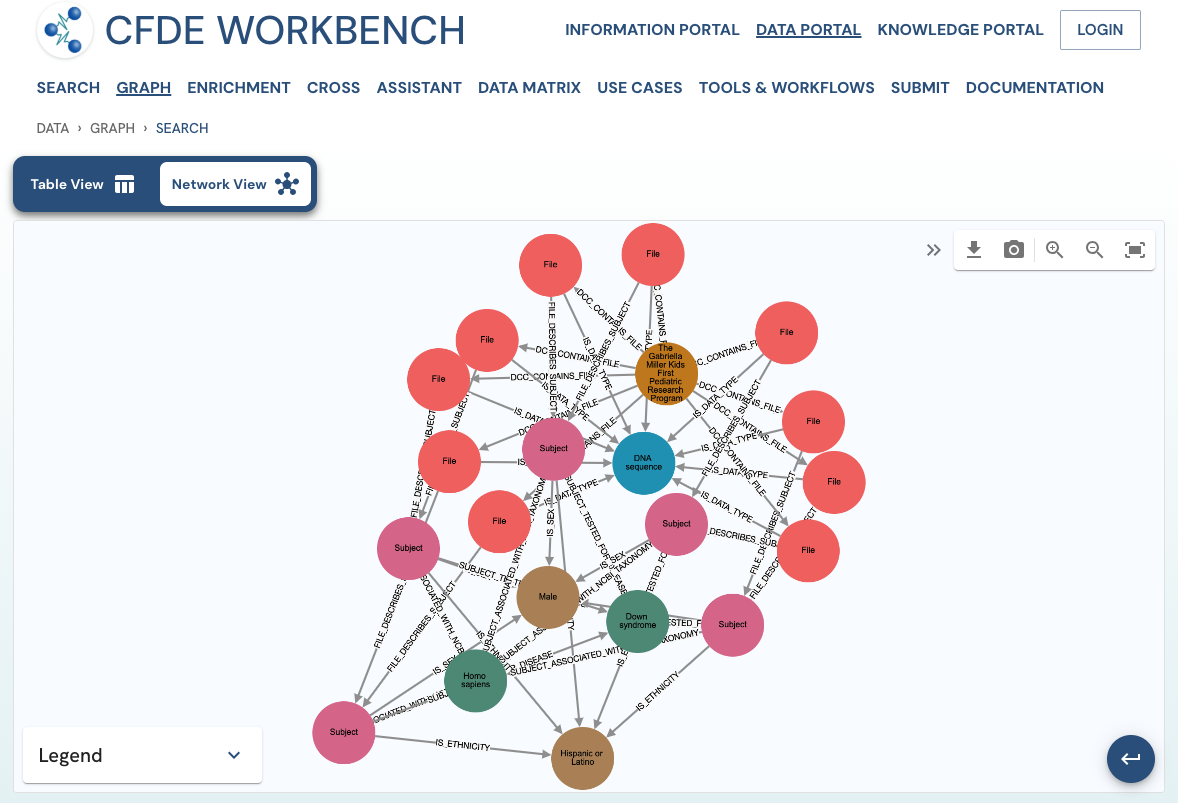
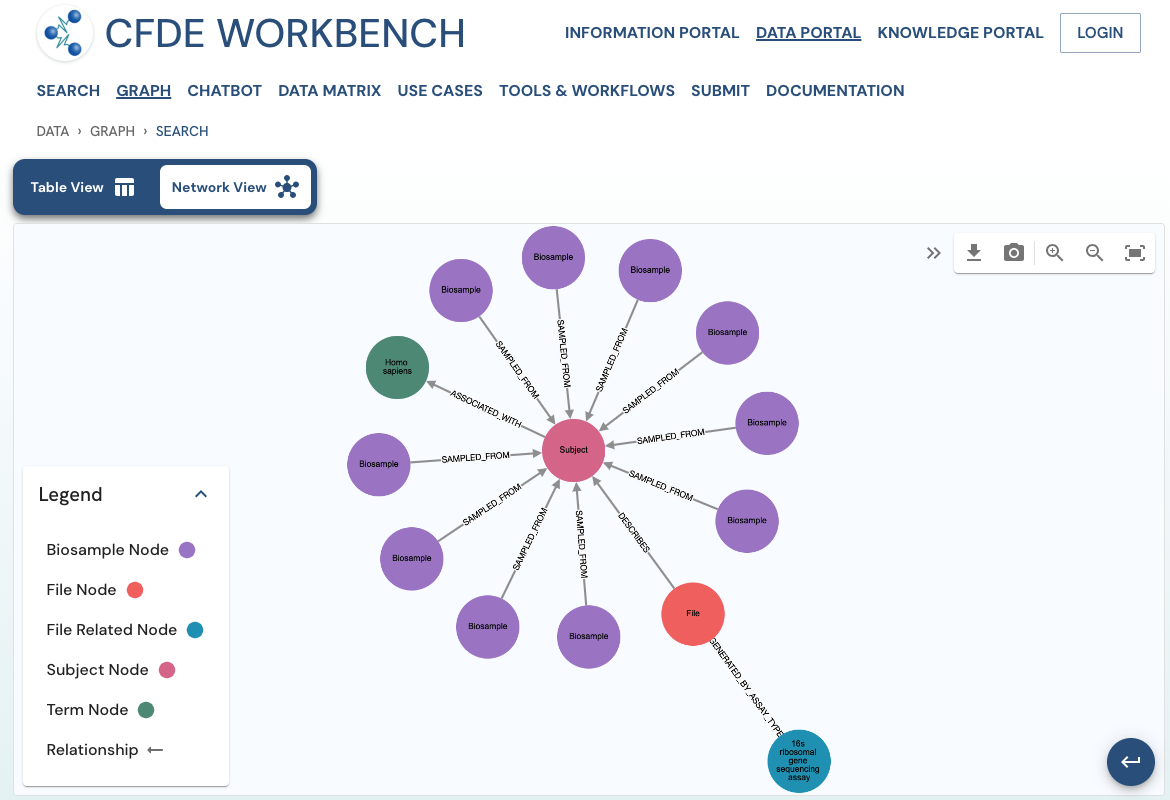
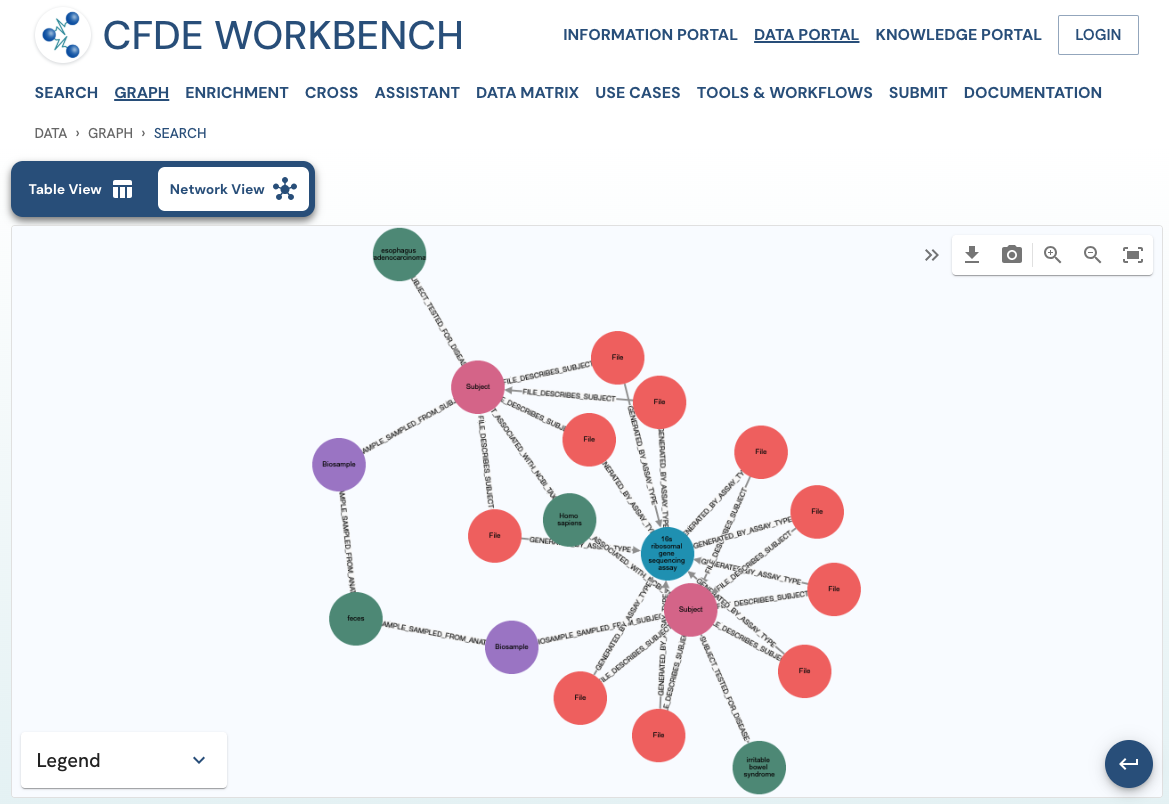
The network view provides a graph network of the current page results, which can also be downloaded as a set of nodes and relationships. The network view is also interactive, and one can view details of a node, segment the graph by node label, find first-degree neighbors, hide nodes, etc.
Use Cases
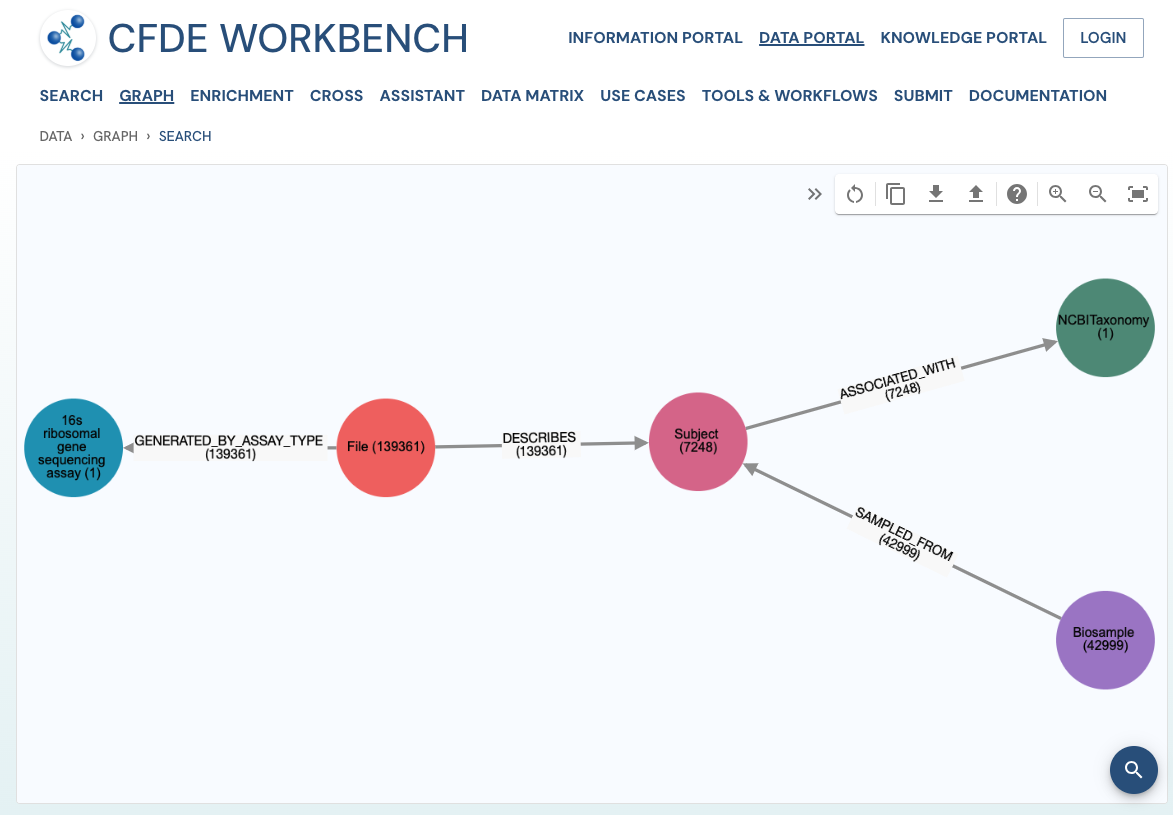
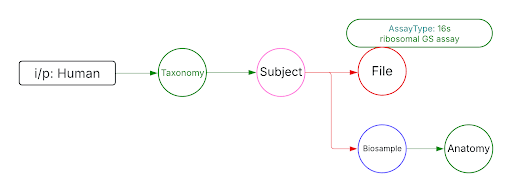
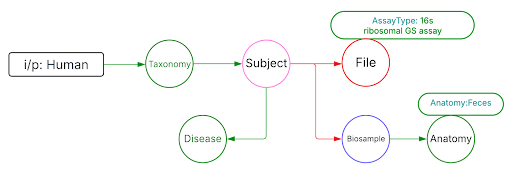
Use Case 1: Federated Query across CF programs. Find all human subjects' data derived from the 16s ribosomal gene sequencing assay from all tissue sources.
Approach: Multiple ways exist to reach all the ribosomal gene sequencing datasets and their tissue sources from human subjects. One such approach is given below:
Use Case 2: Subset the above query to include datasets from stool samples and associated diseases.
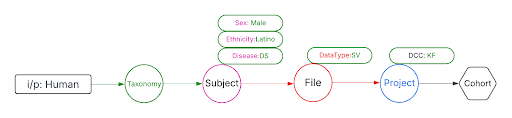
Use Case 3: Cohort Creation. Find all DNA sequence variants datasets from Male Latino Down syndrome subjects in the Kids First DCC.